- Introduction

- Account Opening
- How to Log In into Account
- How to Open Real Account
- How to Open Demo Account
- Changing login
- Adding existing login
- Deleting login
- Changing password
- Changing phone password
- Account properties
- How to Log In into Account
- Trading
- Lock Mode
- Market Order
- How to Set Pending Order
- How to Delete Orders
- How to Change Orders
- Orders Take-Profit and Stop-Loss. Mode “Trailing Stop Distance”
- How to Close the Opened Position
- How to Unlock a Position
- PCI Trading
- Withdrawal requests
- Trading
- Make deal window
- Quick deal window
- Opening a position
- Closing a position
- Unlocking a position
- Possible deviation
- Trading settings
- Make deal window
- Pending orders
- Position orders and Trailing stop
- Orders window
- Placing pending orders
- Editing pending orders
- Deleting pending orders
- Order settings
- Position orders and Trailing stop
- Indicators
- Graphical Objects
- Graphical object list window
- Placing graphical objects
- Editing graphical objects
- Deleting graphical objects
- Graphical object list window
- Alerts
- Alert settings
- Adding alerts
- Editing alerts
- Suspending/resuming alerts
- Removing alerts
- Exporting importing alerts
- Alerts filter
- Setting alerts
- Alert settings
- News
- Lock Mode
- User Interface
- Main Window
- Terminal interface
- General settings
- Customize Windows Position
- Charts
- Synchronous Review of Charts
- How to Work with Charts
- Instrument Chart
- Chart percent window
- Setting chart types
- Setting chart timeframes
- Other chart settings
- Chart sync mode
- Operations for working with charts
- Chart image export
- Chart history settings
- Synchronous Review of Charts
- PCI
- PCI setting window
- Creation of PCI
- Modification of PCI
- Renaming of PCI
- Deleting of PCI
- PCI Export
- PCI Import
- Breakdown PCI position
- Setting notification windows when PCI position is broken
- PCI setting window
- How to Set Indicators
- How to Modify Indicators
- Graphical Objects
- Andrews’ Pitchfork
- Channel
- Channel (ray)
- Fibonacci Arcs
- Fibonacci Fan
- Fibonacci Time Zones
- Fibonacci Retracement
- Gann Fan
- Gann Grid
- Gann Line
- Horizontal Line
- Icon
- Linear Regression Channel
- Oval
- Rectangle
- Standard Deviation Channel
- Text
- Trendline
- Trendline (ray)
- Triangle
- Vertical Line
- Andrews’ Pitchfork
- How to Manage Charts History
- Withdrawal Request
- How to Set Alerts
- Printing
- Customizing Financial Instrument List
- Trading instruments
- Instruments In Use Window
- Instrument Browser Window
- Viewing instrument in use information
- Add to used instruments window
- Removing instruments
- Instruments In Use Window
- Information Windows
- Navigator
- Current quotations
- Margin Analysis
- Open Positions
- Sum Open Positions
- Account History Report
- Orders
- Orders History Report
- Activity Log
- Withdrawal Requests
- News
- Alerts window
- Exporting window contents
- Navigator
- Windows Operation Factors Settings
- Workspace of Login
- How to Add a New Workspace
- How to Rename a Workspace
- How to Delete a Workspace
- How to Set up a Workspace
- Workspaces window
- How to Add a New Workspace
- Using Templates
- Setting terminal elements display
- Setting interface elements visibility
- Hiding interface elements
- Setting modes of window display
- Setting window size and layout
- Sorting information displayed in windows
- Display window settings
- Setting interface elements visibility
- Network connections
- Export Settings
- Main Window
- Quick start guide
- Getting started
- Opening an account
- Logging in
- Trading
- Pending orders
- About position orders and Trailing stop
- Placing pending orders
- Modifying pending orders
- Deleting pending orders
- About position orders and Trailing stop
- Withdrawal requests
- Getting started
- F.A.Q.
- Operations with logins
- Trading instruments
- Charts
- PCI
- Trading
- Pending orders
- Indicators
- Graphical objects
- Alerts
- News
- Withdraw
- Window settings
- Hot keys
- Workspaces
- Workspace templates
- Charts templates
- Patterns of colors and fonts
- Printing
- Exporting/importing settings
- Operations with logins
Installing Ichimoku indicator on NetTradeX Platform
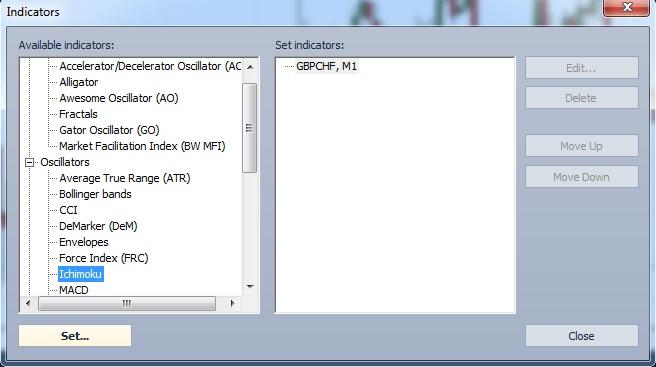
By the command “Indicators” (From the context menu or with the help of the button situated on main mage) user can open dialogue window called “Indicators”, which consists of two parts; “Available Indicators” and “Set indicators”.
First, left part of the window contains the list of indicators. Second, right part of the window contains the list of chosen indicators in a form of a “tree” stating the name of the financial tool on the top of hierarchical indicator list. User can easily find the “Ichimoku” indicator and select it with one click.
Clicking on “Set” Button (on the “Indicators” window), indicator dialogue settings opens name as “Ichimoku Properties”. This consists of two types of tabs; “Data” and “View”.
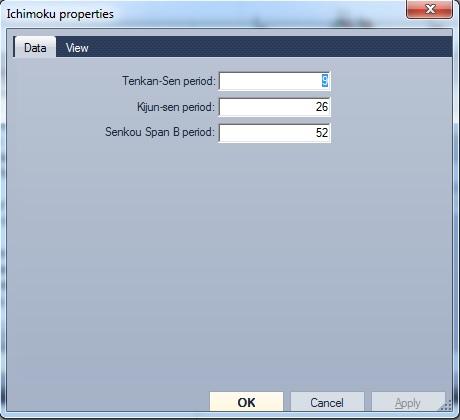
After indicator settings is set user must click on “OK” button to set the indicator on the chart window.
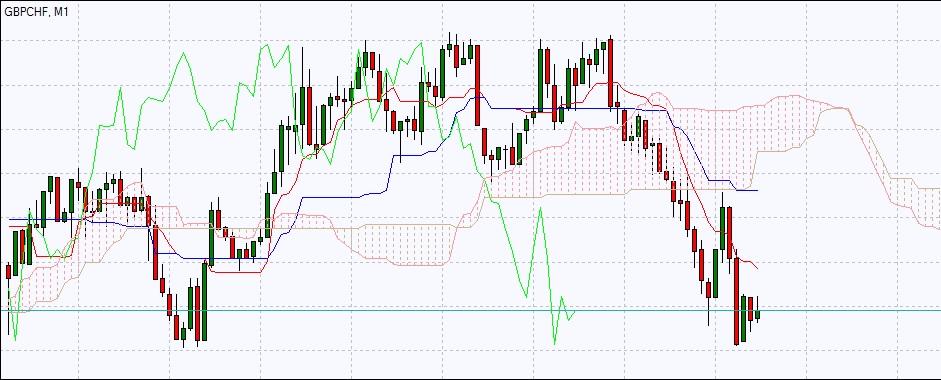
The Ichimoku Kinko Hyo (Equilibrium chart at a glance) is a comprehensive technical analysis tool introduced in 1968 by Tokyo columnist Goichi Hosoda. The concept of the system was to provide an immediate vision of trend sentiment, momentum and strength at a glance perceiving all the Ichimoku's five components and a price in terms of interactions among them of a cyclical type related to that of human group dynamics.