User Guide
User interaction with the program is performed via main program window interface. The description of the basic elements of the window is provided below.
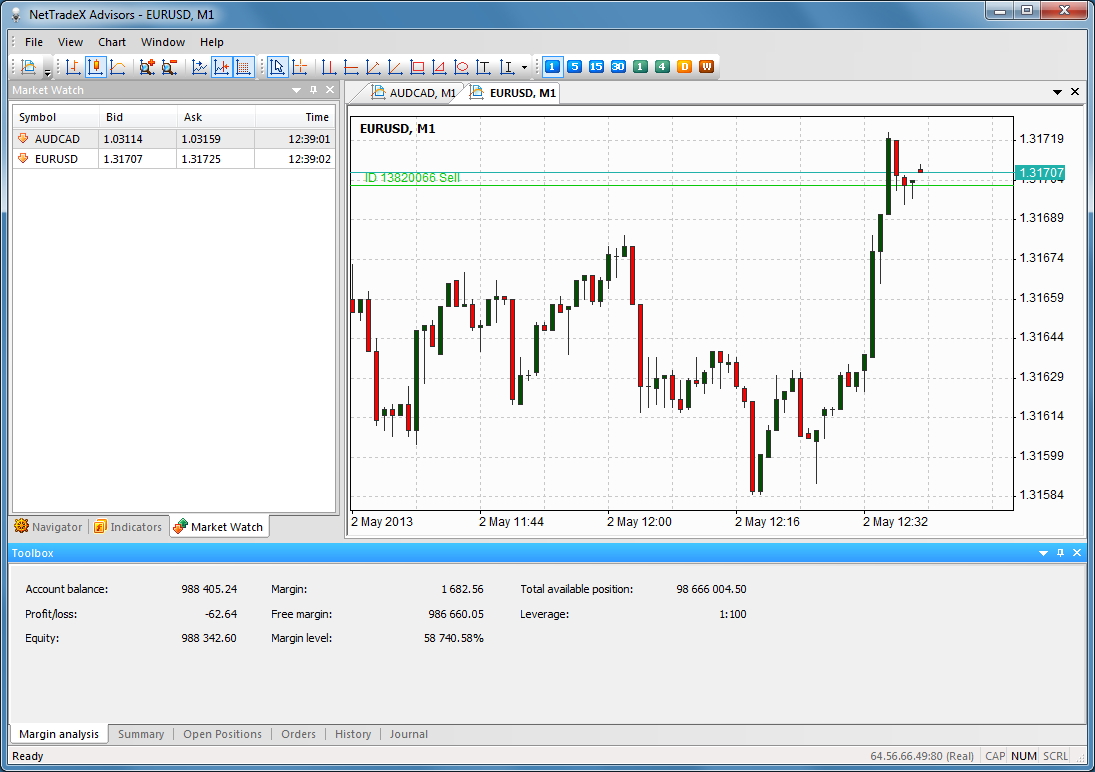
Program window elements:
- Main menu
- Navigator window
- Indicators window
- MarketWatch window
- Logins window
- Toolbox window
- toolbar Standard
- toolbar Interval
- toolbar Charts
- toolbar Objects
- Instrument price chart
Navigator window
The Navigator provides the ability of managing user scripts, tools and indicators.
To display the Navigator select View - Toolbars and Docking Windows and mark the Navigator Navigator.
Navigator window has a tree structure that is divided into three main sections: Advisors , Indicators and Utilities .
The context menu provides the following features for managing scripts:- Attach to chart / Execute on chart - runs the script
- Create - creating a custom script in the folder
- Modify - changing the created script
- Delete - deleting the selected script
- Rename - renaming the selected script
- Create Folder - creating subfolders in the specified folder
- Remove Folder - deleting the folder and all sub-folders and scripts
To run the created script quickly, simply drag it to the price chart.
Root folders Advisors, Indicators и Utilities can not be renamed and deleted.
Indicators window
The Indicators windows allows to use built-in indicators for analysing the situation on financial markets. Custom indicators are divided into the following categories:
- Bill Williams.Bill Williams indicators
- Oscillators. Oscillators
- Trends. Trend indicators
- Volumes. Volume indicators
To display the Indicators window select View - Toolbars and Docking Windows and mark Indicators .
To display an indicator, enter the desired instrument ( File - New Chart ) and drag the indicator from the Indicators window on the chart. Then the dialog window for setting the indicator parameters will pop up. After specifying the parameters, click OK.
Market Watch window
The Market Watch window is used for displaying quotes for selected financial instruments. All instruments are presented in tabular form, each instrument has:- Symbol name Symbol
- Price Bid
- Price Ask
- Time of the latest quote for the symbol
To display the Market Watch window, select View - Toolbars and Docking Windows and mark Market Watch.
If you need quotes, you need to subscribe to the desired symbol. To do this, right click in the Market Watch window and select Subscribe . Mark the desired instruments in the dialog window and click OK .
Adding a symbol in the Market Watch window is automatic when the user displays a chart on the desired instrument, makes a deal, places an order using scripts.
To delete the instrument, click the right mouse button on it and choose Unsubscribe . The Unsubscribe menu item is not available if case the selected instrument is displayed on the chart, there a position or an order on the selected symbol.
To display the symbol chart shown in Market Watch select Open Chart . Too replace the symbol chart, the user can drag the next symbol on the chart from the Market Watch .
Logins window
Logins window is used to quickly switch between different user's accounts. The window displays a tree-like structure containing a list of all accounts that the user used for connections.
To display the Logins window, select menu item View-Toolbars and Docking Windows and tick Logins item.
The context menu is shown on clicking on an account name with the right-hand mouse button. The menu has two items: Connect and Remove. The item Connect is used for changing accounts, the item Remove is for removing the account from the tree.
Symbol chart window
Symbol chart window is used for displaying the desired prices. To display the quotes select the menu, File-New chart , click on the desired symbol and select OK .
For horizontal chart movement, move the cursor while holding the left mouse button on the chart. For vertical scale change, press and hold the left mouse button on the scale of prices, then move the cursor up or down and release the mouse button. For horizontal scale change, press and hold the left mouse button on the scale of time, then move the cursor to the left or to the right and release the mouse button.
Chart context menu
The context menu provides the ability of managing the price chart displaying modes, applying built-in indicators, adding graphical objects etc.Let us consider the chart context menu possibilities:
- Stop and Limit orders - pending order placement
- Scripts - managing running advisers
- Advisor Properties - serves to change the global variables of the custom advisor
- Stop Advisor - stopping the running custom advisor
- Indicators... - displaying a dialog box for adding a built-in indicator
- Objects - placing graphical objects on the chart
- Set Order F3 - displaying a new order setting dialog window
- Make Deal F4 - displaying a new deal making dialog window
- Bars / Candle / Line - switching the chart display mode between the bars, Japanese candles and a line
- Interval - selecting the desired chart interval
- Template - template management
- Refresh - data update in the chart
- Grid - enabling or disabling the grid on the chart
- Auto Scroll - auto-scroll mode. The graph scrolls when it receives new ticks on the symbol.
- Chart Shift - the possibility of shifting a chart from the right
- Show Ask Price - showing Ask price level
- Zoom In - chart zoom in
- Zoom Out - chart zoom out
- Chart Colors - color scheme adjustment
Command prompt
When the price chart window is active, press Enter to open the command prompt. The command prompt When the price chart window is active, press Enter to open the command prompt. The command prompt is used for moving the chart to the desired date quickly and also to switch the symbol and the interval.
Users have the following types of commands available:- Switching to the chart of the desired symbol, for example, "EURUSD" or "GBPUSD"
- Desired interval:
- 1 - M1
- 5 - M5
- 15 - M15
- 30 - M30
- 60 - H1
- 240 - H4
- 1440 - D1
- 10080 - W1
- Symbol, interval. For example "EURUSD, 15"
- YYYY.MM.DD HH:MM Going to the specified date and time
- YYY.MM.DD Going to the specified date
Toolbox window
Toolbox window is used to display the following information:- Margin Analysis- account information
- Summary- general information on grouped open positions
- Open Positions- detailed information on open positions
- Orders- information on the placed orders
- History- information on the closed positions
- Journal- journal(log)
Quick access to dialog windows
- Double-click on the empty space of the Open Positions tab of the Toolbox window brings up a deal making window.
- Double-click on the empty space of the Orders tab of the Toolbox window brings up an order setting dialog window.
- Double-click on the deal on the Open Positions tab brings up a deal closing dialog window.
- Double-click on the order on the Orders tab brings up a dialog order modification window (except for the limit and stop orders linked to open position).
Key combinations to operate the program:
- Ctrl+N - opening a new chart
- F3 - setting an order
- F4 - making a deal
- '+' - zooming in the chart horizontally
- '-' - zooming out the chart horizontally
- Page Up - scrolling the chart one screen back
- Page Down - scrolling the chart one screen forward
- Enter - command prompt