User Guide
- Introduction
- Account Opening
-
Trading
-
Lock Mode
- Market Order
- Pending Order
- How to Set Pending Order
-
How to Delete Orders
-
How to Change Orders
-
Orders Take-Profit and Stop-Loss. Mode “Trailing Stop Distance”
- How to Close the Opened Position
-
How to Unlock a Position
-
PCI Trading
-
Withdrawal requests
- Trading
- Pending orders
- Indicators
- Graphical Objects
- Alerts
- News
-
Lock Mode
-
User Interface
- Main Window
-
Terminal interface
- General settings
- Customize Windows Position
- Charts
- PCI
- How to Set Indicators
-
How to Modify Indicators
- Graphical Objects
-
How to Manage Charts History
-
Withdrawal Request
-
How to Set Alerts
- Printing
-
Customizing Financial Instrument List
- Import Settings
- Trading instruments
- Information Windows
- Windows Operation Factors Settings
- Workspace of Login
- Using Templates
- Setting terminal elements display
- Network connections
-
Export Settings
- Quick start guide
- F.A.Q.
“Chart %” window
Chart % is designed to compare exchange rates of several trade instruments.
The “Chart %” window displays percentage price charts of chosen trade instruments. At the beginning of the chosen timeframe the price of every instrument is taken for 100%. The chart will show the price change in % in relation to the initial value.
The “Chart %” window also contains the floating “Info Panel”, displaying the color of every instrument, and the quotes, corresponding to the current cursor position on the chart.
Opening “Chart %” window
To open “Chart %” window go to the “Chart % Parameters” window by doing one of the following:
- Click “Chart %...” in the menu, which appears after right-clicking the corresponding line in the following windows: “Market watch”, “Sum open positions”, “Open positions”, “Orders”. You may also right-click an instrument name inside the “Instruments” folder in the “Navigator” window.
- Go to “Trade –> Chart % …” in the menu bar.
- Go to “Chart % –> Chart % …” in the menu bar if the button is active.
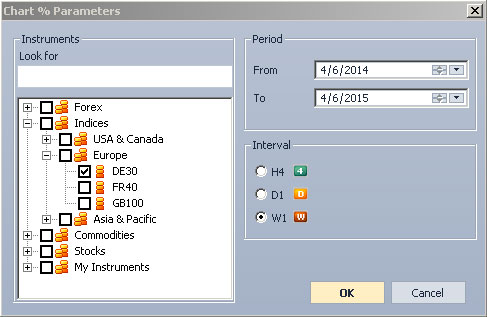
Customize the “Chart % Parameters %” window:
- Choose up to 10 instruments you want to analyze from the “Instruments” [“Instruments”] tree by putting ticks next to the instrument names. To accelerate search use the “Look for” field. It allows a user to sort out instruments that correspond to an entry template.
- Customize the following chart parameters:
- “Period”
- “Interval”.
- Press “ОК” to create a Chart % or “Cancel” to exit.
Customizing Chart %
To customize Chart % open the “Chart % Parameters” window by doing one of the following:
- Right-click in the “Chart %”window and press “Parameters”.
- Click the “Chart % ” window and press “Chart % –> Parameters ” in the menu bar.
Stopping Chart % data loading
If data in the “Chart %” window are loaded too slowly, you may stop downloading by doing one of the following:
- Right-click in the “Chart %” window and “Stop chart loading”.
- Press “Chart % –> Stop chart loading” in the menu bar.